


Sound familiar? If you have spent any meaningful time trading financial markets, this scenario will feel painfully recognizable. And the frustrating truth is that this is not a coincidence, a random event, or even bad luck. It is a deliberate and systematic mechanism known as a liquidity grab — one of the most powerful and frequently misunderstood concepts in modern trading.
Understanding liquidity grabs is not just about protecting yourself from getting stopped out at the wrong moment. It is about fundamentally shifting the way you see price action. Once you understand how and why liquidity grabs occur, you begin to read the market through the eyes of institutional traders rather than as a retail participant being consistently caught on the wrong side of the trade.
This guide will walk you through everything you need to know: what a liquidity grab is, how market makers and institutions use them, how to identify them on a chart, how they differ from stop hunts and market structure shifts, and most importantly — how to build a trading strategy around them. Whether you trade forex, crypto, or equities, this knowledge applies across all markets and timeframes.
What Is a Liquidity Grab?
To understand this concept fully, you need to appreciate what liquidity actually means in a market context. Liquidity refers to the availability of orders in the market — the volume of buy and sell orders waiting to be filled at various price levels. For an institution to enter a large position worth hundreds of millions of dollars, it needs a counterparty — someone on the other side of that trade. It cannot simply place a massive market order without pushing the price dramatically against itself.
This is where retail traders unknowingly become essential participants in institutional strategy. When retail traders place stop-loss orders below support levels or above resistance levels, those stop losses are actually opposite orders waiting to be triggered. A stop loss on a long trade is a sell order. A stop loss on a short trade is a buy order. Institutions know that these clusters of stop orders represent a pool of available liquidity.
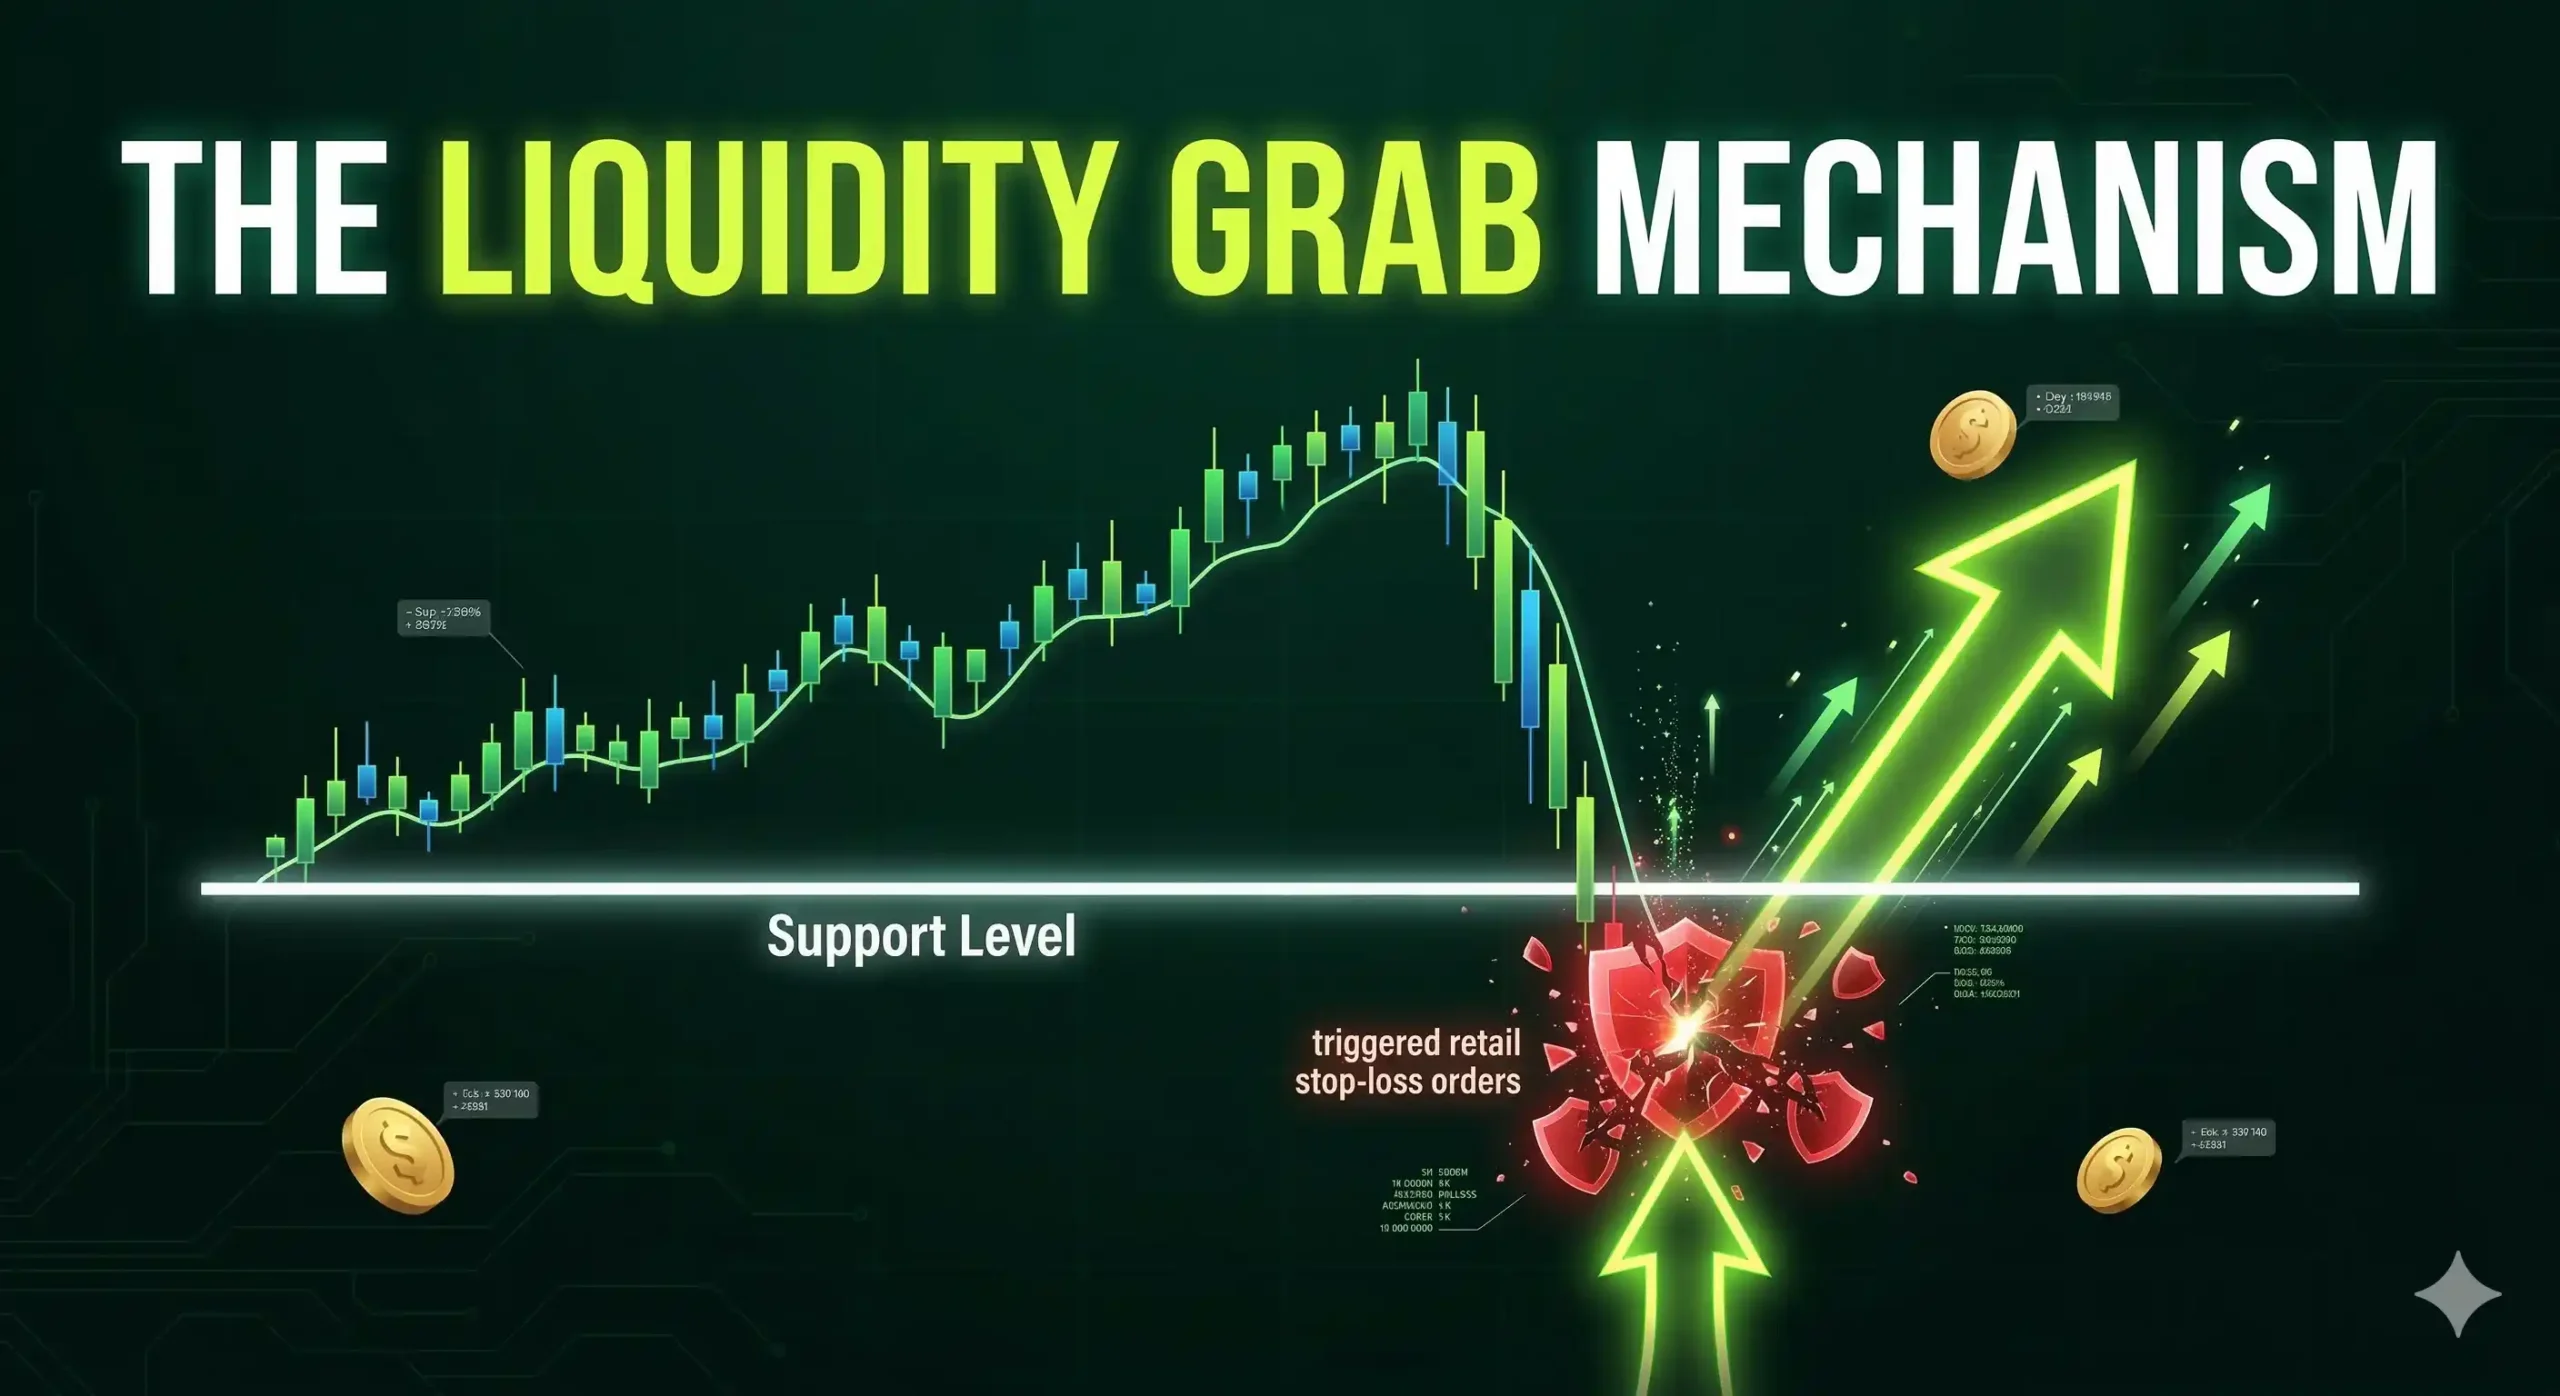
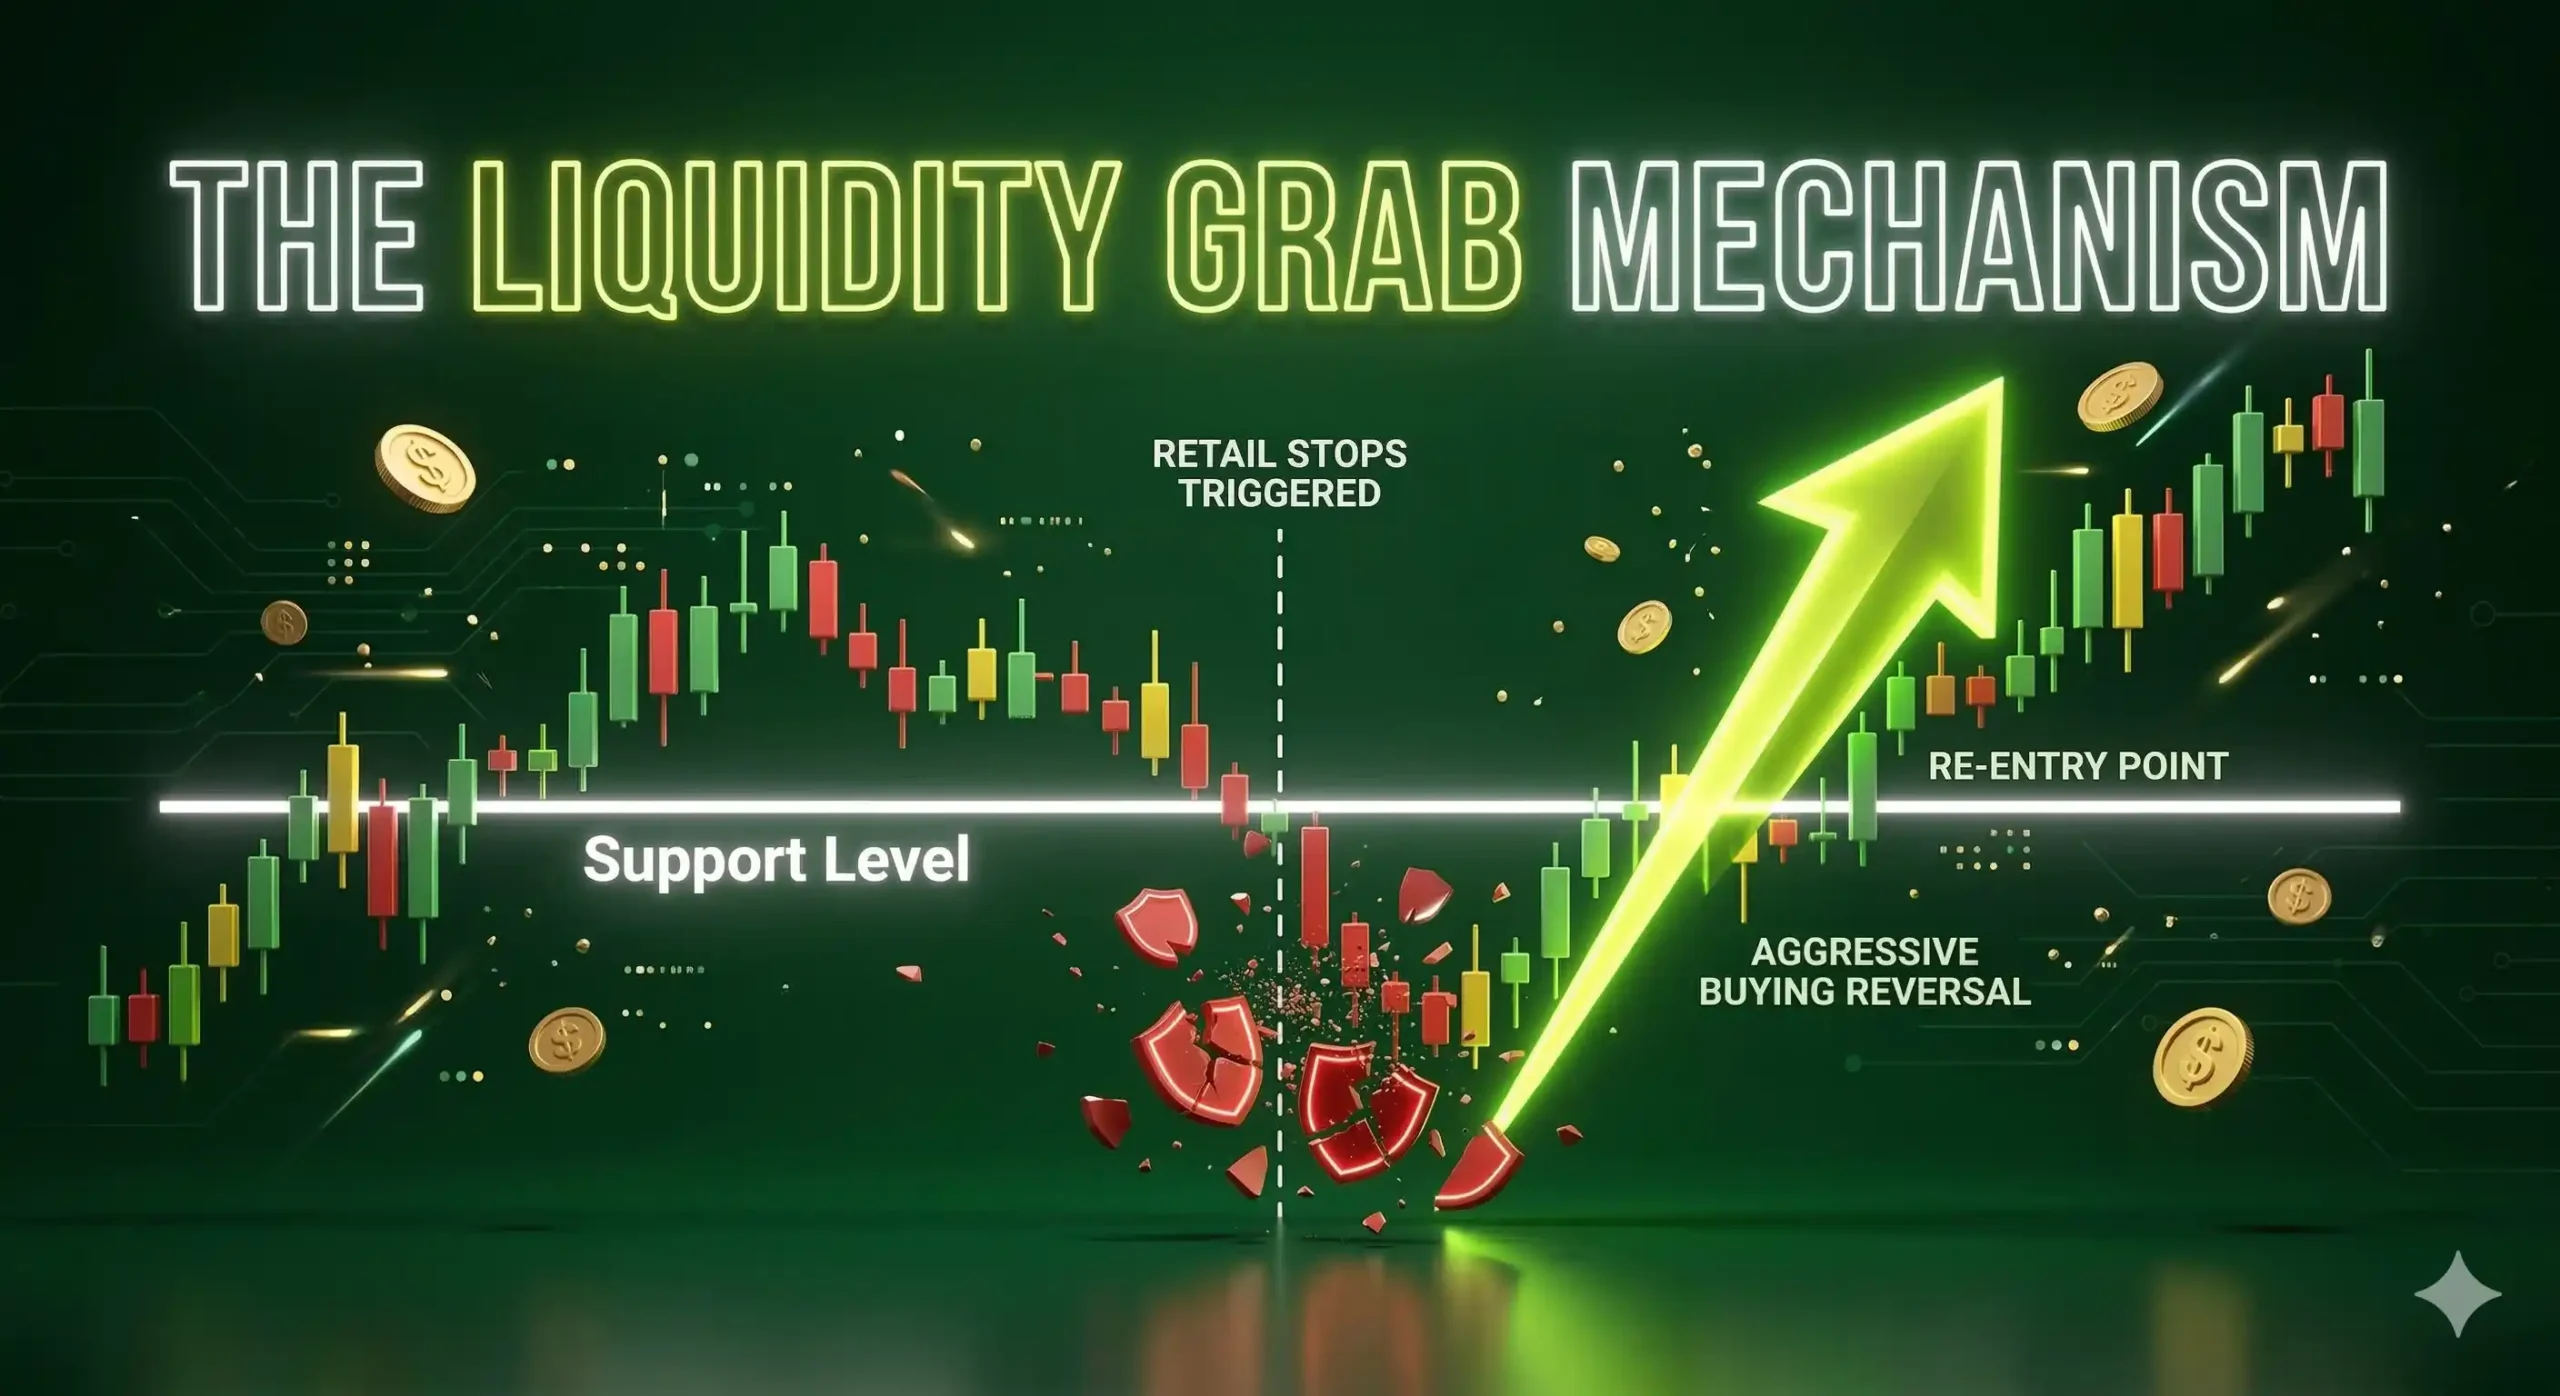
By engineering a temporary price move that sweeps through those stop loss clusters, institutions accomplish two things simultaneously: they trigger the retail orders — creating the liquidity they need — and they fill their own large positions at a favorable price before the market reverses in the direction they always intended to trade. The price spike that triggers the stops is often brief, sometimes lasting only a few seconds on lower timeframes, before snapping back into the previous range with force.
A core feature of the liquidity grab is the candlestick pattern it produces: a long wick that extends beyond a key level, followed by a close back within the range. This is the visual fingerprint of institutional activity and, once you know what to look for, you will see it everywhere across all markets and timeframes.
The Role of Market Makers and Institutional Traders
To fully appreciate why liquidity grabs happen, it is essential to understand the difference between how retail traders and institutional traders operate in the market. Retail traders — individuals trading from home accounts — deal in relatively small position sizes. A trade of even $100,000 has virtually no impact on a liquid market like EUR/USD or Bitcoin. Institutions, however, operate at a completely different scale.
A hedge fund, investment bank, or large asset manager might need to take a position worth $500 million or more. At that scale, simply hitting the market with a market order would cause massive slippage — the act of buying itself would push the price up before the full order is filled, resulting in a significantly worse average entry price. This is known as market impact, and it is one of the central problems that institutional trading desks spend enormous resources trying to minimize.
Market makers play a particularly important role in this ecosystem. A market maker is an entity — typically a large bank or specialized firm — that provides liquidity to the market by standing ready to buy and sell at quoted prices. They profit from the spread between bid and ask prices, but they also have significant influence over short-term price movements. Market makers are acutely aware of where large concentrations of orders exist in the market, and they have both the tools and the incentive to move price toward those order pools.
This is why liquidity grabs are not simply random price spikes. They are the result of deliberate price engineering — moving the market to a specific level where orders are concentrated, triggering those orders, and using the resulting transaction volume to fill large institutional positions at an ideal entry price. The retail traders whose stops were triggered are now out of their trades, while the institution has entered a large position at the very level where retail was stopped out. The subsequent reversal then runs in the institution’s favor.
This dynamic repeats across all markets — forex, equities, futures, and cryptocurrency — because the underlying mechanics of order flow and market structure are universal. Smart money always needs liquidity on the other side of the trade, and liquidity grabs are the mechanism by which that transfer of risk is engineered.
Buy-Side vs. Sell-Side Liquidity
One of the most important concepts related to liquidity grabs is the distinction between buy-side and sell-side liquidity. These two terms describe where liquidity pools are located relative to current price, and understanding them is fundamental to anticipating where liquidity grabs are likely to occur.
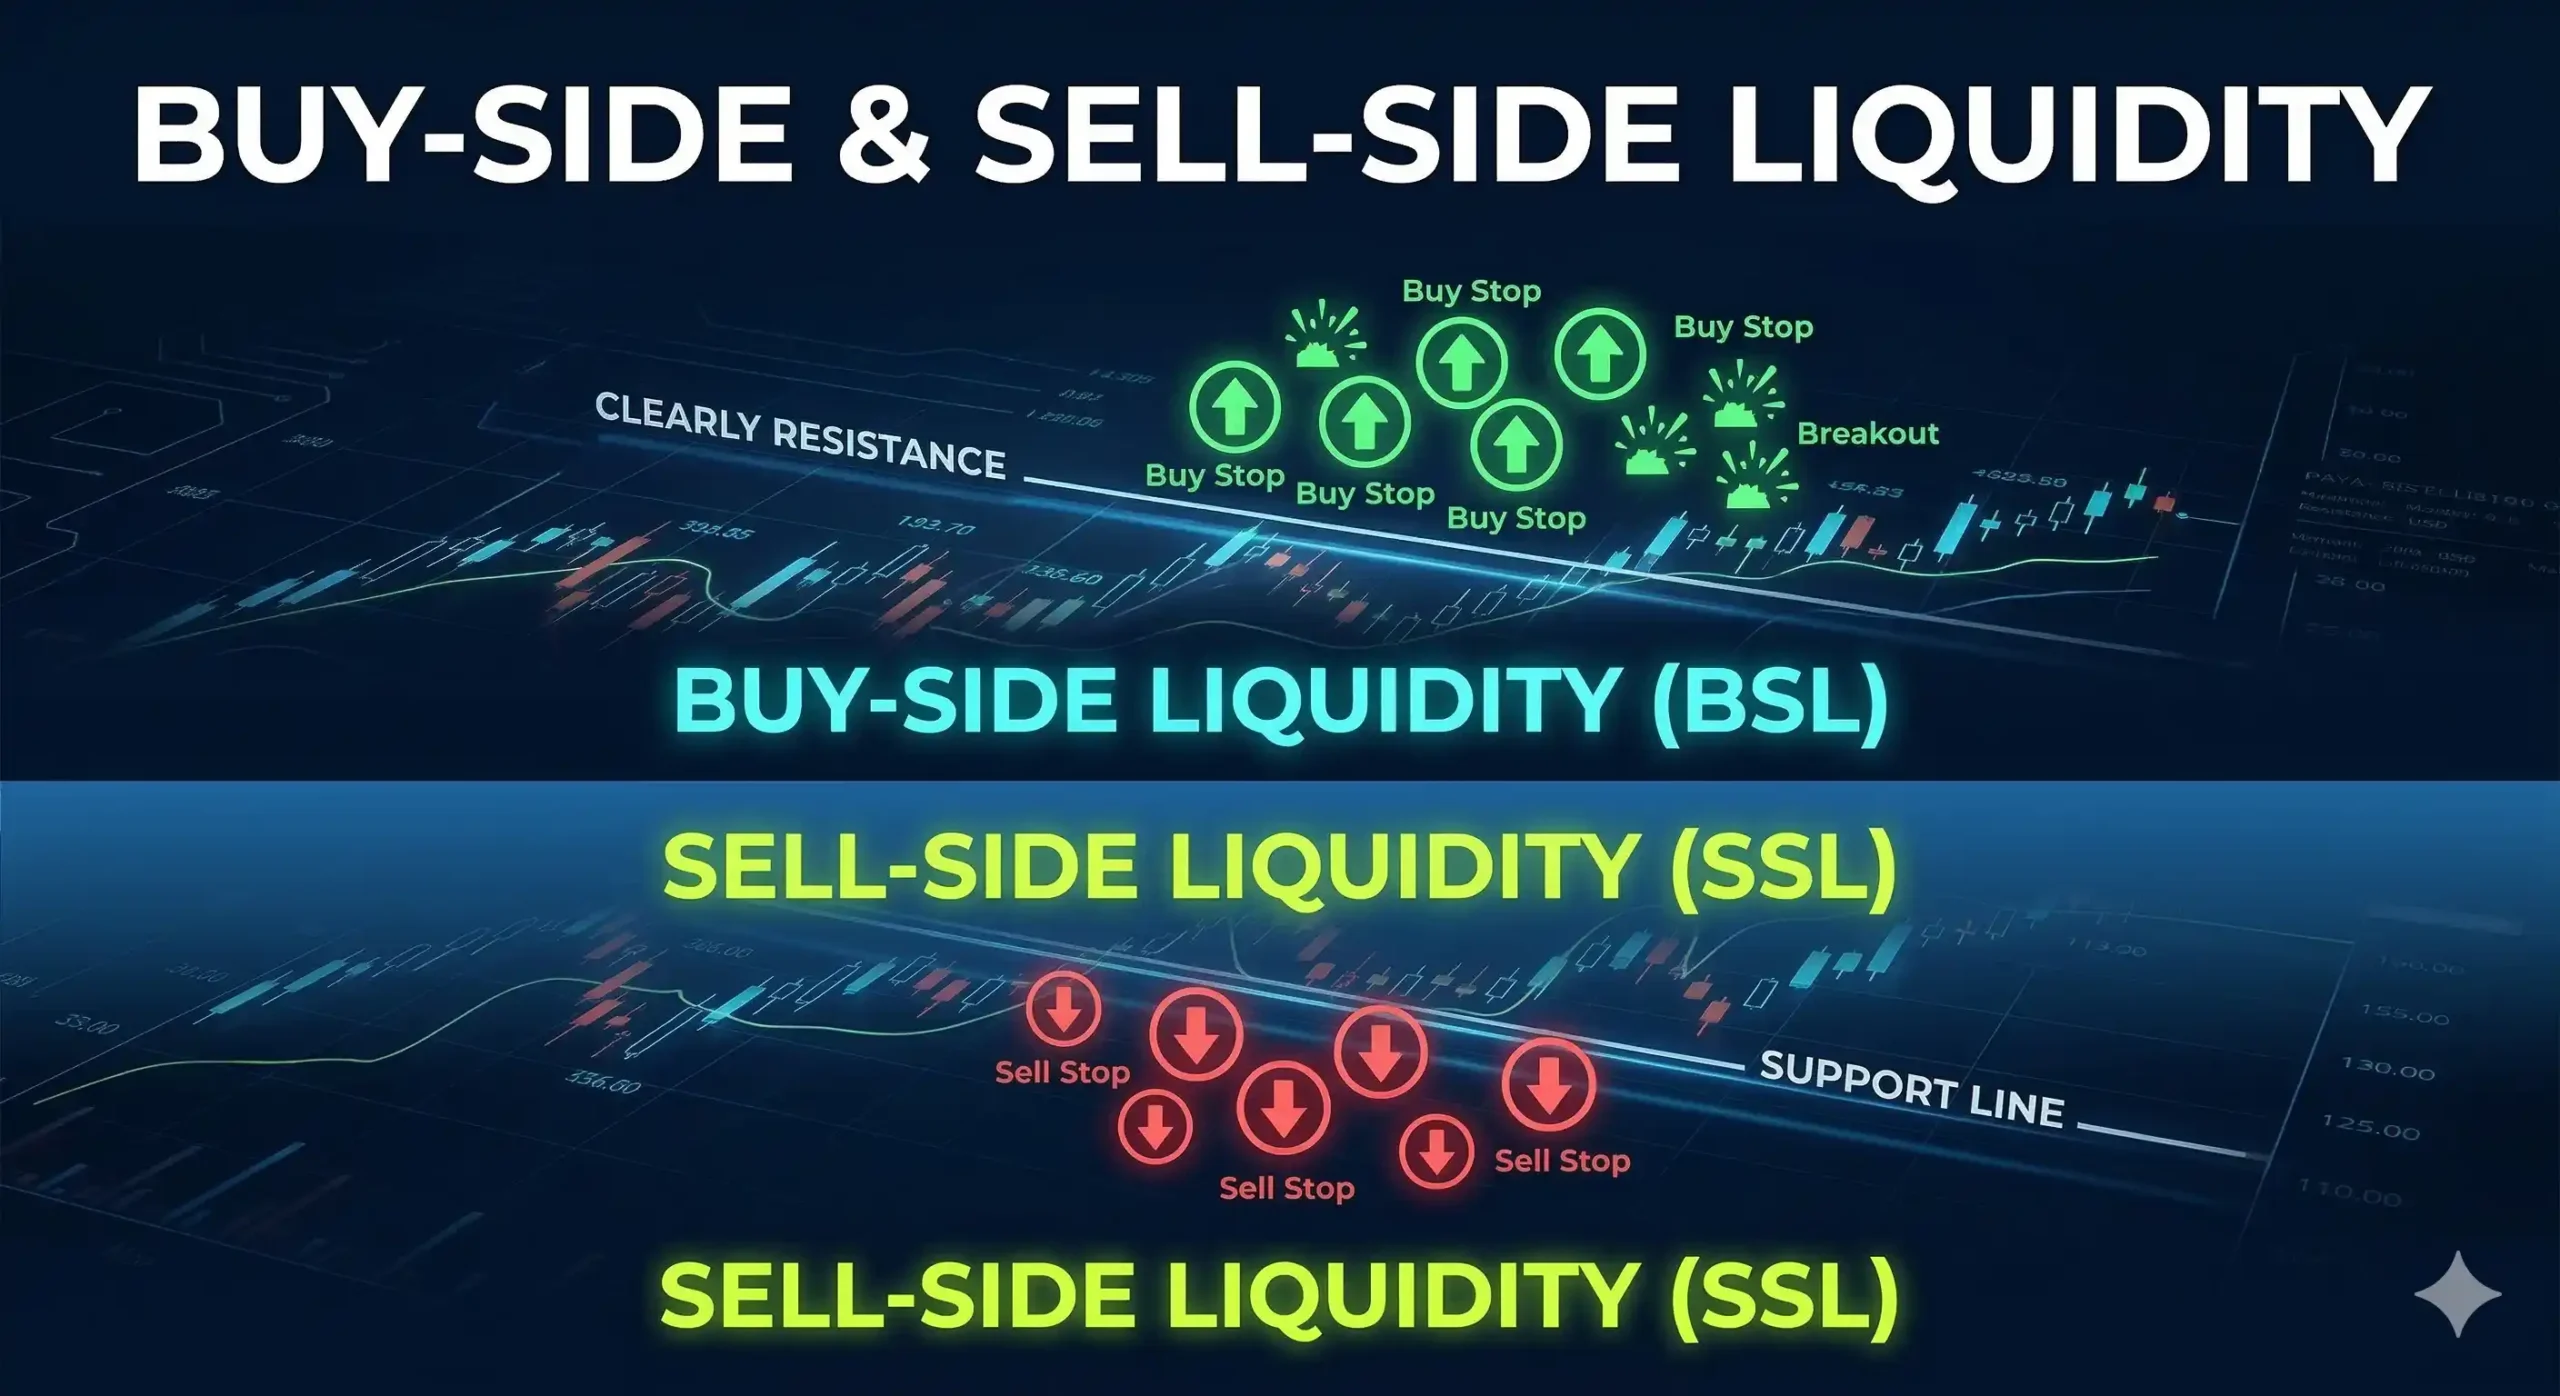
Buy-Side Liquidity refers to the concentration of buy orders that exist above key price levels — specifically above swing highs, previous day highs, previous week highs, and round number resistance levels. Why do buy orders cluster above these levels? Because traders who have entered short positions place their stop losses above these resistance points. Additionally, breakout traders who are waiting to buy the moment price clears a high also place their buy orders above these levels.
From an institutional perspective, if they need to sell a large position short, they need buyers on the other side. The buy-side liquidity sitting above swing highs is exactly what they need. By pushing price above a key high, they trigger all those stop losses and breakout buy orders, creating a flood of buying activity that gives the institution the volume it needs to distribute its short position. Once the position is filled, price reverses lower — trapping the retail breakout buyers who just entered at the worst possible price.
Sell-Side Liquidity is the opposite — it refers to the concentration of sell orders that exist below key price levels, specifically below swing lows, previous day lows, and round number support levels. Traders with long positions place their stop losses below these support levels, and breakout sellers wait below these levels to enter short trades.
If an institution needs to buy a large long position, it requires sellers on the other side. The sell-side liquidity below swing lows provides those sellers. By engineering a temporary break below a key low, institutions trigger the sell stop orders and the short breakout entries, creating the selling volume they need to accumulate their long positions. Once they are filled, price reverses higher — leaving retail short sellers trapped in a losing trade.
How to Identify a Liquidity Grab Pattern
Identifying a liquidity grab on a chart requires training your eye to recognize specific price action signatures that distinguish genuine breakouts from engineered sweeps. Here is a step-by-step process for spotting liquidity grab patterns with consistency.
- Step 1 — Identify Key Levels Where Stops Are Clustered. Begin by marking the most obvious price levels on your chart: previous swing highs and lows, equal highs or lows (double tops and bottoms), the high and low of the previous session, and round psychological numbers. These are the levels where retail traders are predictably placing their stop loss orders, making them the primary targets for liquidity grabs.
- Step 2 — Watch for a Price Spike Beyond the Level. A liquidity grab begins with a price move that extends just beyond the key level. On a candlestick chart, this appears as a wick that pierces through the high or low with conviction — often accompanied by a brief surge in volume. The key characteristic here is that the body of the candle does not close beyond the level. The wick extends through, triggers the stops, and then price is rejected back into the range.
- Step 3 — Look for an Immediate and Sharp Reversal. The defining feature that separates a liquidity grab from a genuine breakout is the speed and conviction of the reversal. After sweeping the level, price should snap back quickly and with force, often closing back within the previous range within the same candle or within the next one or two candles. A genuine breakout will typically consolidate beyond the level or continue in the breakout direction. A liquidity grab reverses immediately.
- Step 4 — Confirm with Volume or Order Flow. On platforms that provide volume data or order flow analysis, a liquidity grab often shows a spike in volume at the point of the sweep — representing all the triggered stop orders — followed by a sharp decline in volume as price retreats. This volume signature helps confirm that the move was driven by order execution rather than genuine directional conviction from the broader market.
- Step 5 — Assess the Timeframe. Liquidity grabs occur on every timeframe, from one-minute charts to weekly charts. However, they carry the most weight and produce the most reliable trading setups on higher timeframes — the one-hour, four-hour, and daily charts. Grabs on these timeframes represent significant institutional activity and tend to produce larger subsequent moves. Lower timeframe grabs can be useful for precise entry timing once a higher timeframe grab has been identified.
Equal highs and equal lows deserve special attention. When price creates two or more swing points at exactly the same level, it signals that a massive pool of stop orders is clustered right above or below that level. These are sometimes called double tops or double bottoms in retail trading, but from a smart money perspective, they are magnets for liquidity grabs.
Liquidity Grab vs. Stop Hunt: Are They the Same Thing?
If you spend time in trading communities online, you will encounter both terms — liquidity grab and stop hunt — used to describe what appears to be the same market event. While they are closely related and often used interchangeably, there is a subtle but important distinction between them.
A stop hunt specifically refers to the action of driving price to a level where stop loss orders are known to be concentrated, with the explicit purpose of triggering those orders. The term emphasizes the predatory nature of the move — the market is being deliberately pushed to “hunt” retail stop losses. It is action-oriented, describing what is being done to the market.A liquidity grab is the broader concept that encompasses not just the action of triggering stops but also the underlying purpose — collecting the liquidity generated by those triggered orders to fill institutional positions. The term emphasizes the economic rationale: institutions are not just hunting stops for sport; they are grabbing the liquidity those stops represent in order to execute their own large orders efficiently.
In practice, the two terms describe the same phenomenon from slightly different angles. A stop hunt is a liquidity grab, and a liquidity grab almost always involves some degree of stop hunting. The distinction matters mostly for conceptual clarity — understanding that there is always a reason behind these moves rather than it simply being random market manipulation.
For practical trading purposes, you can treat these terms as interchangeable. The important thing is not the label but the recognition of the pattern and the ability to respond to it profitably rather than being victimized by it.
Liquidity Grab vs. Market Structure Shift (MSS)
One of the most common points of confusion among traders learning smart money concepts and ICT methodology is the difference between a liquidity grab and a Market Structure Shift (MSS). Both involve price moving to a key level, but they describe fundamentally different market events with different implications for subsequent price action.
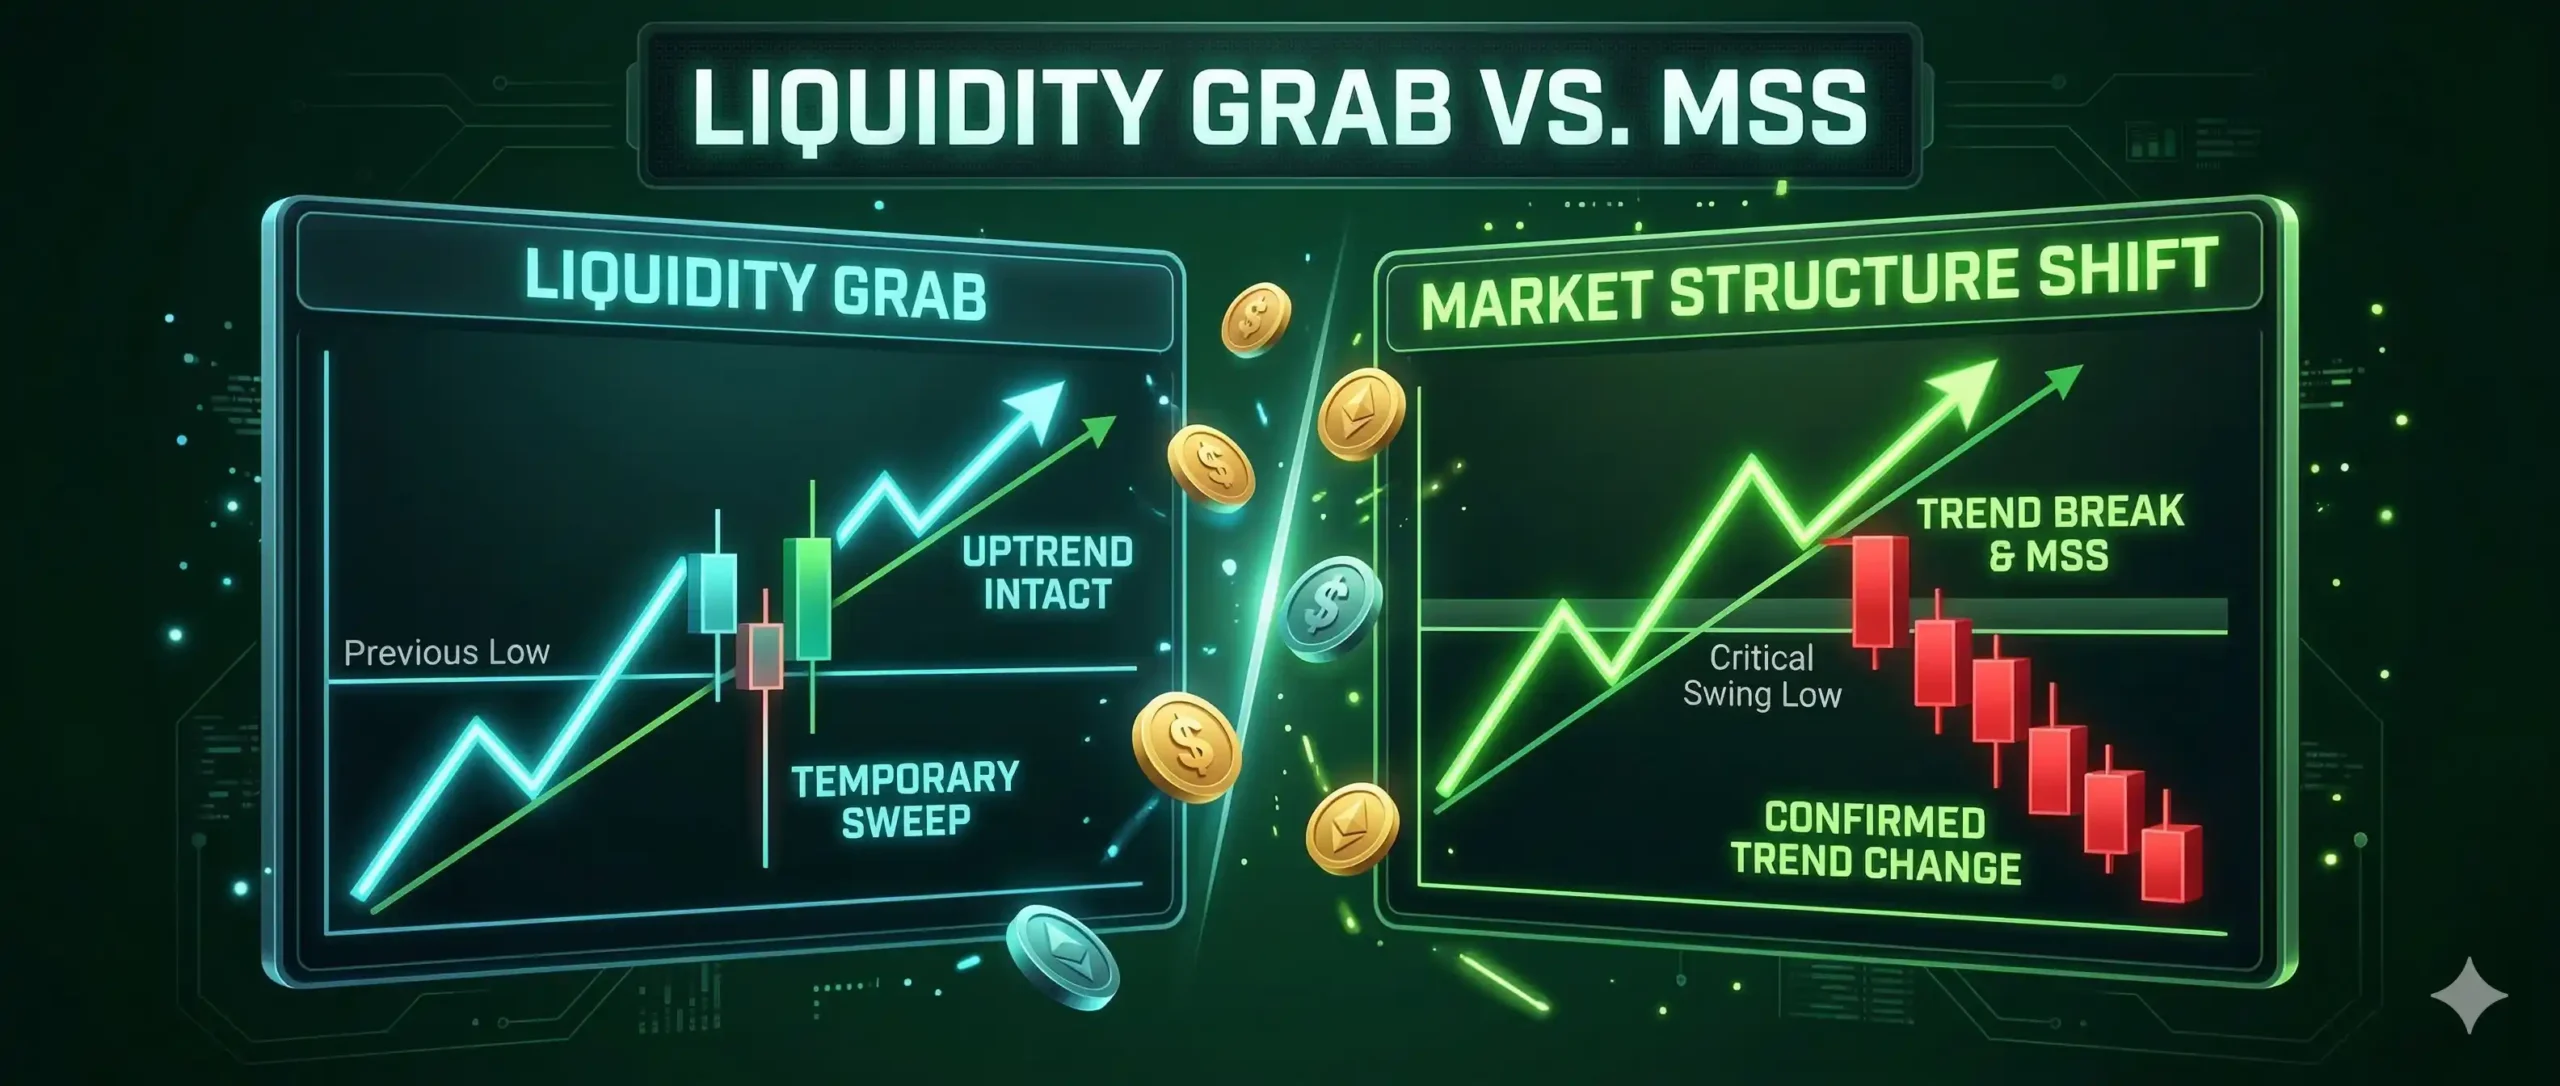
A liquidity grab is a temporary move beyond a key level that is immediately reversed. The key word is temporary. Price sweeps through the level, collects the stop orders, and snaps back. Market structure — the pattern of higher highs and higher lows in an uptrend, or lower highs and lower lows in a downtrend — remains intact after the grab. The overall trend has not changed.
A Market Structure Shift, by contrast, occurs when price breaks a key swing level and sustains that break — indicating a genuine change in the direction of the trend. In an uptrend, a MSS is confirmed when price breaks below a significant swing low and continues moving lower, creating a new lower low. In a downtrend, a MSS is confirmed by a break above a key swing high that holds, creating a new higher high. The shift is confirmed not by a spike and reversal, but by a sustained move that changes the sequence of price action.
The practical difference is critical for trading decisions. If you see a liquidity grab, you are looking for a reversal trade — entering in the direction of the snapback after the stop hunt. If you see a Market Structure Shift, you are looking to trade in the new direction of the trend — following the break rather than fading it.
A common sequence in ICT methodology is: liquidity grab first, then Market Structure Shift. Price sweeps a level to collect liquidity, then reverses and breaks the opposing structure, confirming a change in the market’s direction. The grab acts as the catalyst that provides institutions with the liquidity they need to reverse the market, and the MSS confirms that the reversal has indeed taken place. Learning to identify this sequence is one of the most powerful skills a trader can develop.
Liquidity Grab Trading Strategy: Step-by-Step
Understanding liquidity grabs theoretically is one thing. Knowing how to trade them profitably is another. Here are three proven strategies for trading liquidity grabs across different market conditions.
Strategy 1: The Double Top / Double Bottom Sweep
This is one of the most reliable and visually clean setups for trading liquidity grabs. It exploits the natural tendency of retail traders to place stops above double tops — equal highs — and below double bottoms — equal lows.
Look for a price pattern where two swing highs or swing lows form at nearly identical price levels. This creates a horizontal zone where a large number of stop orders are clustered. Wait for price to approach this zone and then break just beyond the equal high or equal low — often by just a few pips or ticks — before reversing sharply. Wait for the sweeping candle to close back within the range, confirming the rejection is genuine. For a sell setup after sweeping equal highs, enter short after the close back below the high. For a buy setup after sweeping equal lows, enter long after the close back above the low.
Place your stop loss a comfortable distance above the sweep high for short trades, or below the sweep low for long trades. Since the liquidity grab has already occurred, price should not need to revisit that extreme. Target the nearest significant liquidity pool on the opposing side — risk-to-reward ratios of 1:2 to 1:4 are commonly achievable on this setup, particularly on higher timeframes.
Strategy 2: Trading the Fakeout
The fakeout strategy focuses specifically on false breakouts from consolidation ranges, chart patterns, or trend lines. This setup is particularly effective in ranging markets where price repeatedly tests the boundaries of a trading range before eventually breaking out.
Identify a clear consolidation range with well-defined highs and lows. Wait for price to break beyond one boundary of the range on what appears to be a legitimate breakout. The fakeout is confirmed when price fails to follow through and reverses back into the range within one to three candles. Look for a reversal candlestick pattern — such as a pin bar or engulfing candle — after the fakeout. Additionally, check if the breakout occurred during a low-volume period, as fakeouts are more common outside of major trading sessions when liquidity is naturally thinner.
Enter after the fakeout candle closes back within the range, and keep your stop loss tight — just beyond the extreme of the fakeout wick. Since the setup is based on a failed breakout, price should not revisit the extreme of the false move if the reversal is genuine.
Strategy 3: ICT-Based Liquidity Grab Entry
This strategy incorporates the broader ICT methodology, combining liquidity grabs with Fair Value Gaps, session timing, and market structure to produce high-probability entry signals.
Begin with a top-down analysis. On the daily or four-hour chart, identify the current market structure and the nearest liquidity pool in the direction of the dominant trend. For example, in an uptrend, identify the nearest sell-side liquidity pool below a swing low that price may sweep before continuing higher.
Liquidity grabs are significantly more reliable when they occur during the London open (2:00 AM to 5:00 AM EST) and the New York open (7:00 AM to 10:00 AM EST). These are the periods of highest institutional activity, and the kill zones within these sessions are when the most significant liquidity sweeps tend to occur.
After a liquidity grab, look for price to pull back into a Fair Value Gap — a three-candle pattern where the middle candle creates a gap between the wicks of the surrounding candles. FVGs act as magnets for price and serve as excellent entry points with tight stop losses. A liquidity grab followed by a pullback into an FVG, within a session kill zone, aligned with the higher timeframe trend, is one of the highest-probability setups available to retail traders.
Why Retail Traders Fail at Support and Resistance
The conventional retail approach to trading support and resistance is seductively simple: buy at support, sell at resistance, place your stop below the support or above the resistance. It is logical, visually clean, and exactly what almost every beginner trading course teaches. It is also precisely why so many retail traders struggle to be consistently profitable.
The problem with this approach is not that support and resistance do not matter — they absolutely do. The problem is the predictability of where retail traders place their stops. When everyone in the market is following the same playbook and placing stops at the same logical locations, it creates a highly predictable pool of orders that institutions can exploit.
Consider the self-defeating nature of the standard approach: the more traders who identify the same support level, the more stop orders cluster below it, and the more attractive it becomes as a liquidity grab target. In other words, the more obvious and universally recognized a support or resistance level is, the more likely it is to be swept before any genuine move takes place.
This is why traders who learn about liquidity grabs often describe it as having a veil lifted from their eyes. Levels that previously seemed to fail at the worst possible moments are suddenly understood as intentional — the stops below the level were always the target, not a casualty of a legitimate breakout.
The solution is not to stop using support and resistance — it is to stop placing your stops at the exact location where everyone else does. Understanding liquidity grabs allows you to place stops beyond the likely sweep zone, or better yet, to wait for the sweep to occur before entering the trade. Instead of being the one who gets stopped out, you become the one who enters after the stop hunt and benefits from the subsequent reversal.
Liquidity Grabs in Forex vs. Crypto
While the underlying mechanics of liquidity grabs are universal across all financial markets, there are notable differences in how they manifest in forex and cryptocurrency markets that traders should be aware of.
In Forex, the market is the largest and most liquid in the world, with daily trading volumes exceeding $7 trillion. Liquidity grabs in forex tend to be more precise and calculated — the sweeps are often only a few pips beyond the key level, just enough to trigger the clustered stops without creating an obvious anomaly on the chart. The London open and New York open sessions are the most common times for forex liquidity grabs, as these are when institutional volume is highest and market makers are most active. Retail forex traders face the additional challenge of leverage, which makes being on the wrong side of a liquidity grab particularly damaging. A highly leveraged account can be significantly impacted by a stop hunt that would otherwise be a manageable temporary loss.
In Crypto, markets present a different liquidity landscape. While major cryptocurrencies like Bitcoin and Ethereum have grown substantially in liquidity, they remain significantly less liquid than major forex pairs. This means that liquidity grabs in crypto tend to be more dramatic — the wicks are larger, the sweeps more exaggerated, and the reversals more violent. The 24/7 nature of crypto markets means grabs can occur at any hour, though they tend to be most significant during overlapping Asian and Western trading hours when institutional participation is highest.
Crypto markets are also more susceptible to coordinated price moves by larger holders — sometimes called whales — who have the capital to temporarily push prices through key levels. The relatively lower liquidity means that a smaller amount of capital is required to sweep a significant level compared to a major forex pair, making crypto particularly prone to frequent and aggressive liquidity grabs. One particularly important concept for crypto traders is the risk of account flipping — where aggressive use of leverage in combination with liquidity grabs leads to rapid and catastrophic account losses. Understanding liquidity grabs can quite literally protect your trading capital from these devastating outcomes.
Frequently Asked Questions
What is a liquidity grab in trading?
A liquidity grab occurs when the market price moves to a specific area where many stop-loss orders are placed, triggering them to create enough liquidity for institutional players to enter large positions. It is characterized by a sharp price move beyond a key level followed by an immediate reversal back into the previous range.
Is a liquidity grab the same as a stop hunt?
They are very closely related and often used interchangeably. A stop hunt specifically describes the action of driving price to hit retail stop losses, while a liquidity grab is the broader concept that encompasses both the action and the purpose — collecting the resulting liquidity to fill institutional orders. In practice, every stop hunt is a liquidity grab.
How do you identify a liquidity sweep on a chart?
Look for a price spike — typically appearing as a long wick on a candlestick — that extends beyond a key level such as a swing high, swing low, double top, or round number. The critical feature is that the candle body closes back within the previous range, indicating rejection of the breakout. This spike-and-reversal pattern is the visual signature of a liquidity grab.
Why do institutions use liquidity grabs?
Institutional traders need to fill large orders without causing massive slippage. By triggering retail stop losses — which are opposite orders that provide the needed volume — institutions can execute their large positions at favorable prices. Without this liquidity pool, entering a position of hundreds of millions of dollars would push the price significantly against them before they are fully filled.
What is the best timeframe for trading liquidity grabs?
Liquidity grabs occur on all timeframes, but they are most significant and reliable on the one-hour, four-hour, and daily charts. Grabs on these timeframes represent substantial institutional activity and tend to produce larger and more sustained subsequent moves. Lower timeframes like the 15-minute chart can be used to time entries once a higher-timeframe grab has been identified.
What is the difference between a liquidity grab and a Market Structure Shift?
A liquidity grab involves a quick sweep of a key level followed by an immediate reversal — market structure remains intact after the grab. A Market Structure Shift involves a sustained break of a key structural level that confirms a change in the direction of the prevailing trend. In ICT methodology, the two often occur in sequence: a liquidity grab provides the fuel for a subsequent Market Structure Shift that confirms the trend reversal.
Can liquidity grabs be predicted in advance?
While no market event can be predicted with absolute certainty, liquidity grabs are among the more predictable patterns in trading precisely because they target obvious, well-known price levels. By identifying the most significant clusters of retail stop orders on your chart — equal highs, equal lows, previous session extremes — you can anticipate the most probable zones where a liquidity grab is likely to occur, then wait for the sweep to develop before entering your trade.
Conclusion: Thinking Like Smart Money
Liquidity grabs represent one of the most fundamental mechanisms in how financial markets actually function — as opposed to how retail trading education often presents them. The standard narrative of support holding, resistance being respected, and breakouts running cleanly in the direction of the break is regularly upended by the reality that institutional traders are continuously engineering price moves to collect the liquidity they need to operate at scale.
Understanding liquidity grabs does not make you immune to them. The market will still occasionally fool even the most experienced traders. But it fundamentally changes your relationship with the market. Instead of approaching a key support level with the intention of buying and placing a stop just below it — making yourself the perfect prey for a liquidity sweep — you approach it with patience, waiting to see whether the level is respected or swept before committing to a direction.
This shift in perspective — from reactive to observational, from victim to informed participant — is the practical value of understanding smart money concepts. You are not going to out-trade the institutions. But you can stop trading against them and start trading alongside them by recognizing the patterns their activity leaves on the chart.
The strategies outlined in this guide — the double top sweep, the fakeout entry, and the ICT-based confluent setup — give you a framework for doing exactly that. Start by backtesting these setups on historical data, then move to identifying them in real time before committing real capital. The discipline of waiting for a confirmed liquidity grab before entering — rather than placing stops at obvious levels and hoping the level holds — will fundamentally transform the quality of your trade entries.
Markets are not random. They are driven by order flow, and order flow is driven by the needs of large institutional participants who must have liquidity to operate. Liquidity grabs are how that liquidity is collected. Once you understand that, you stop seeing price spikes as random noise and start seeing them as the most important signals on the chart.

A stock market enthusiast with hands-on experience in trading. He writes simple and practical content to help people understand the market better.