


Market Structure in SMC Trading is one of the most important topics in Smart Money Concepts. If you do not understand Market Structure in SMC Trading, then liquidity, order blocks, fair value gaps, BOS, and CHOCH will all feel random. Many traders try to learn advanced SMC setups first, but the truth is simple: without a strong understanding of Market Structure in SMC Trading, it becomes very hard to read the chart properly.
Market Structure in SMC Trading helps a trader understand whether the market is bullish, bearish, or moving sideways. It shows who is currently in control — buyers or sellers. Once you understand Market Structure in SMC Trading, the chart starts making more sense. You stop taking random entries and start following the actual direction of price. That is why this topic is considered the backbone of SMC trading.
What Is Market Structure in SMC Trading
Market Structure in SMC Trading means the pattern of highs and lows that price forms over time. Price never moves in a straight line forever. It creates swings, retracements, impulses, and reversals. These repeated movements create structure, and that structure tells you the condition of the market.
In simple words, Market Structure in SMC Trading helps answer these questions:
- Is the market going up?
- Is the market going down?
- Is the market ranging?
- Has the market changed direction?
- Is the current move strong or weak?
When you understand Market Structure in SMC Trading, you can identify trend direction before thinking about entries. This improves decision-making and reduces unnecessary confusion.
Why Market Structure in SMC Trading Matters
Market Structure in SMC Trading matters because it gives context. A trader may see a bullish candle, but that candle alone means very little without structure. If the market is bearish overall, then that bullish candle may only be a pullback. If the market is bullish, then the same candle may be continuation.
That is why Market Structure in SMC Trading is so important. It prevents traders from reacting to every candle emotionally. Instead, it teaches traders to first understand the overall story of price. Once the structure is clear, then liquidity, order blocks, and imbalances become much easier to use.
A trader who understands Market Structure in SMC Trading can:
- follow the dominant trend better
- avoid trading against strong momentum
- find cleaner continuation setups
- detect possible reversals earlier
- improve overall trade selection
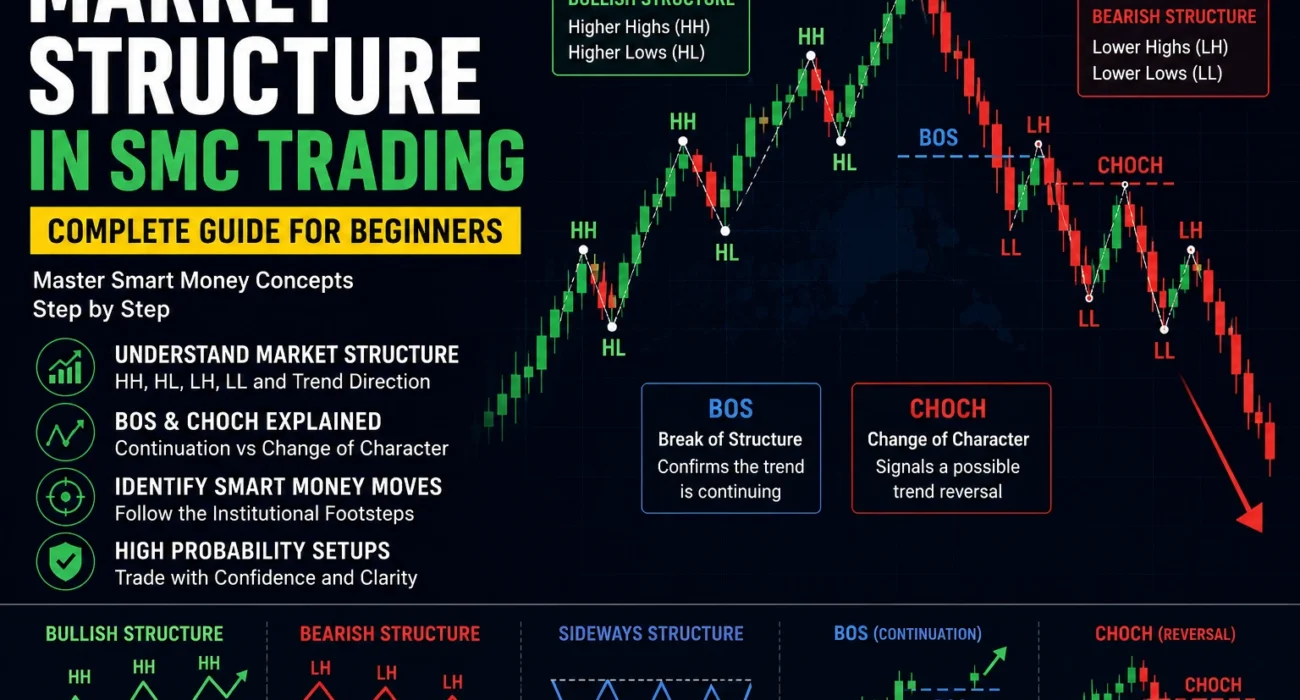
Market Structure in SMC Trading and Higher Highs
Market Structure in SMC Trading becomes easier when you first learn higher highs and higher lows. In a bullish market, price normally creates a higher high after making a higher low. This shows that buyers are still in control.
A higher high means price breaks above the previous important high. In Market Structure in SMC Trading, this usually confirms bullish continuation. If the market keeps making higher highs and higher lows, it means the bullish trend is still healthy.
For example, if price moves up, pulls back, and then rises again to break the previous high, that is bullish structure. In Market Structure in SMC Trading, this is a basic sign of strength. It shows that buyers were strong enough not only to defend the pullback but also to push price to a new high.
Market Structure in SMC Trading and Higher Lows
Market Structure in SMC Trading also depends on higher lows in a bullish trend. A higher low means the market pulls back but does not fall below the previous major low. This shows that buyers are still willing to step in earlier than before.
In Market Structure in SMC Trading, higher lows are very important because they show the market is respecting bullish demand. A market that keeps making higher lows is usually healthy on the bullish side. But if price starts failing to make higher lows, then that can be an early warning sign.
Many traders focus only on higher highs, but Market Structure in SMC Trading teaches that both higher highs and higher lows must be observed together. A single breakout does not mean much if the lows are weak. Real bullish structure is built by both.
Market Structure in SMC Trading and Lower Highs
Market Structure in SMC Trading also includes bearish structure. In a bearish market, price usually forms lower highs and lower lows. A lower high means price tries to move up but fails to break the previous high and turns down earlier.
In Market Structure in SMC Trading, lower highs are signs that sellers are still in control. The market is not strong enough to continue upward, so every bullish retracement gets sold into. This creates a staircase-like bearish pattern on the chart.
When you identify lower highs clearly, Market Structure in SMC Trading becomes more logical. You stop thinking every bounce is a reversal. Instead, you start seeing some upward moves as only temporary corrections inside a bearish trend.
Market Structure in SMC Trading and Lower Lows
Market Structure in SMC Trading becomes fully bearish when price forms lower lows. A lower low means price breaks below the previous important low. This confirms that sellers are continuing to dominate.
In Market Structure in SMC Trading, lower lows are important because they show bearish continuation. If price keeps falling below previous lows after each pullback, then the structure is still bearish. Traders should respect that until there is a clear shift.
A lower low is not just a random down move. In Market Structure in SMC Trading, it shows that selling pressure is strong enough to push through previous support. That is why traders often wait for lower lows before fully accepting bearish continuation.
Market Structure in SMC Trading and Bullish Structure
Market Structure in SMC Trading is called bullish when price consistently forms higher highs and higher lows. This means the market is moving upward with strength. Buyers are defending pullbacks, and price keeps progressing to new highs.
A bullish Market Structure in SMC Trading usually has these signs:
- clear higher highs
- clear higher lows
- strong impulsive bullish candles
- weaker bearish pullbacks
- price respecting bullish reaction zones
When the structure is bullish, traders using Market Structure in SMC Trading usually look for buying opportunities rather than selling opportunities. This does not mean every bullish trade will work. It means the probability improves when you align with bullish structure.
Market Structure in SMC Trading and Bearish Structure
Market Structure in SMC Trading is called bearish when price consistently forms lower highs and lower lows. This means sellers are in control and the market is moving downward.
A bearish Market Structure in SMC Trading usually has these signs:
- clear lower highs
- clear lower lows
- strong bearish impulsive moves
- weak bullish corrections
- rejection from bearish zones
In bearish structure, traders using Market Structure in SMC Trading usually focus more on short opportunities or avoid aggressive bullish entries. The biggest benefit of understanding this is that it keeps you aligned with the actual flow of the market.
Market Structure in SMC Trading and Sideways Market
Market Structure in SMC Trading is not always bullish or bearish. Sometimes the market moves in a range. In such conditions, price keeps reacting between a visible high and a visible low without making a strong directional move.
This is called a sideways or ranging market. In Market Structure in SMC Trading, a range is important because trend rules become weaker inside it. Traders often get trapped when they assume a trend exists in a market that is actually ranging.
A sideways Market Structure in SMC Trading often shows:
- repeated highs
- repeated lows
- no clean continuation
- false breakouts
- messy candle behavior
In these conditions, patience becomes very important. The best approach in Market Structure in SMC Trading is to wait for clean breakout confirmation or a proper shift in structure before taking aggressive trades.
Market Structure in SMC Trading and BOS
Market Structure in SMC Trading includes an important concept called BOS, which means Break of Structure. A BOS usually confirms continuation. In a bullish market, when price breaks above the previous high, that can be a bullish BOS. In a bearish market, when price breaks below the previous low, that can be a bearish BOS.
In Market Structure in SMC Trading, BOS helps traders confirm that the current trend is still continuing. It tells you that the dominant side still has control. For example, if the market is bullish and then breaks above a previous swing high after a pullback, that is a strong sign of continuation.
BOS becomes more meaningful when it happens with momentum. In Market Structure in SMC Trading, a weak break is not as strong as a clean, impulsive break with strong candles.
Market Structure in SMC Trading and CHOCH
Market Structure in SMC Trading also includes CHOCH, which means Change of Character. CHOCH is often seen as an early sign that the market may be shifting direction. It is different from BOS because BOS usually confirms continuation, while CHOCH often suggests possible reversal or change in control.
For example, if the market was bullish and price suddenly breaks below an important higher low, that may be a bearish CHOCH. In Market Structure in SMC Trading, this can signal that buyers are weakening and sellers may be taking over.
But CHOCH should not be used carelessly. In Market Structure in SMC Trading, not every CHOCH becomes a full reversal. Sometimes price shifts internally and then continues in the larger trend. That is why context and timeframe matter a lot.
Market Structure in SMC Trading and Internal vs External Structure
Market Structure in SMC Trading can be studied on different levels. External structure means the major trend or big swings on higher timeframes. Internal structure means the smaller movements happening inside those bigger swings.
This is important because sometimes a lower timeframe may look bearish while the higher timeframe is still bullish. In Market Structure in SMC Trading, both levels matter. A smart trader first checks the higher timeframe for bias, then uses the lower timeframe for entry refinement.
For example, if daily structure is bullish but the 15-minute chart shows a short-term bearish correction, that correction may simply be a pullback rather than a full reversal. This is why internal and external Market Structure in SMC Trading should always be studied together.
Market Structure in SMC Trading and Trend Shift
Market Structure in SMC Trading becomes especially powerful when you can identify a trend shift early. A trend shift happens when the market stops respecting the old structure and starts building the opposite one.
A bullish-to-bearish shift in Market Structure in SMC Trading may look like this:
- market was making higher highs and higher lows
- price fails to make a new high
- price breaks an important higher low
- structure starts forming lower highs
A bearish-to-bullish shift is simply the opposite. Identifying this shift correctly helps traders avoid staying attached to the old trend for too long.
Market Structure in SMC Trading and Common Mistakes
Market Structure in SMC Trading is simple in theory, but traders still make mistakes. One common mistake is focusing on tiny swings instead of meaningful swings. Another mistake is analyzing structure on one timeframe only and ignoring the higher timeframe.
Some common mistakes in Market Structure in SMC Trading are:
- marking every minor high and low
- ignoring overall trend
- confusing pullback with reversal
- using BOS and CHOCH without context
- forcing a trend in a range market
- entering trades before structure confirms
The solution is to keep structure reading clean and objective. In Market Structure in SMC Trading, simplicity often works better than over-analysis.
How to Practice Market Structure in SMC Trading
Market Structure in SMC Trading improves through chart practice. Open a clean chart and do these steps:
- Mark the major swing high and swing low.
- Identify whether price is bullish, bearish, or ranging.
- Check if the market is forming HH-HL or LH-LL.
- Mark any BOS or CHOCH.
- Compare higher timeframe and lower timeframe structure.
This daily routine can improve your understanding quickly. The more charts you study, the more natural Market Structure in SMC Trading becomes. Over time, you will start recognizing strong trends, weak pullbacks, and potential reversals much faster.
Conclusion
Market Structure in SMC Trading is the backbone of Smart Money Concepts. If you understand how price forms higher highs, higher lows, lower highs, and lower lows, then the market becomes much easier to read. Once Market Structure in SMC Trading becomes clear, advanced concepts like liquidity, BOS, CHOCH, order blocks, and fair value gaps start making practical sense.
The biggest advantage of learning Market Structure in SMC Trading is that it improves your decision-making. You stop taking random trades and start following actual chart logic. A strong foundation in Market Structure in SMC Trading helps traders stay aligned with trend, avoid emotional mistakes, and build long-term consistency.
ALSO READ: Price Action in SMC Trading: Complete Beginner Guide for Beginners
FAQs
What is Market Structure in SMC Trading?
Market Structure in SMC Trading means the pattern of highs and lows that price forms over time. It helps traders understand trend direction, continuation, and reversal.
Why is Market Structure in SMC Trading important?
Market Structure in SMC Trading is important because it gives chart context. Without it, order blocks, liquidity, BOS, and CHOCH become difficult to use properly.
What is bullish Market Structure in SMC Trading?
Bullish Market Structure in SMC Trading means price is forming higher highs and higher lows. This usually shows that buyers are in control.
What is bearish Market Structure in SMC Trading?
Bearish Market Structure in SMC Trading means price is forming lower highs and lower lows. This usually shows that sellers are in control.
What is the difference between BOS and CHOCH in Market Structure in SMC Trading?
In Market Structure in SMC Trading, BOS usually confirms continuation, while CHOCH often signals a possible trend shift or reversal.
If you want, I can write the next SMC topic in the same format with a matching featured image.

A stock market enthusiast with hands-on experience in trading. He writes simple and practical content to help people understand the market better.